Tools
Big datasets can be challenging and time-consuming to understand. Our main focus is to provide clear explanations what has been discovered with sharp and often interactive visualizations as part of publications.
Data
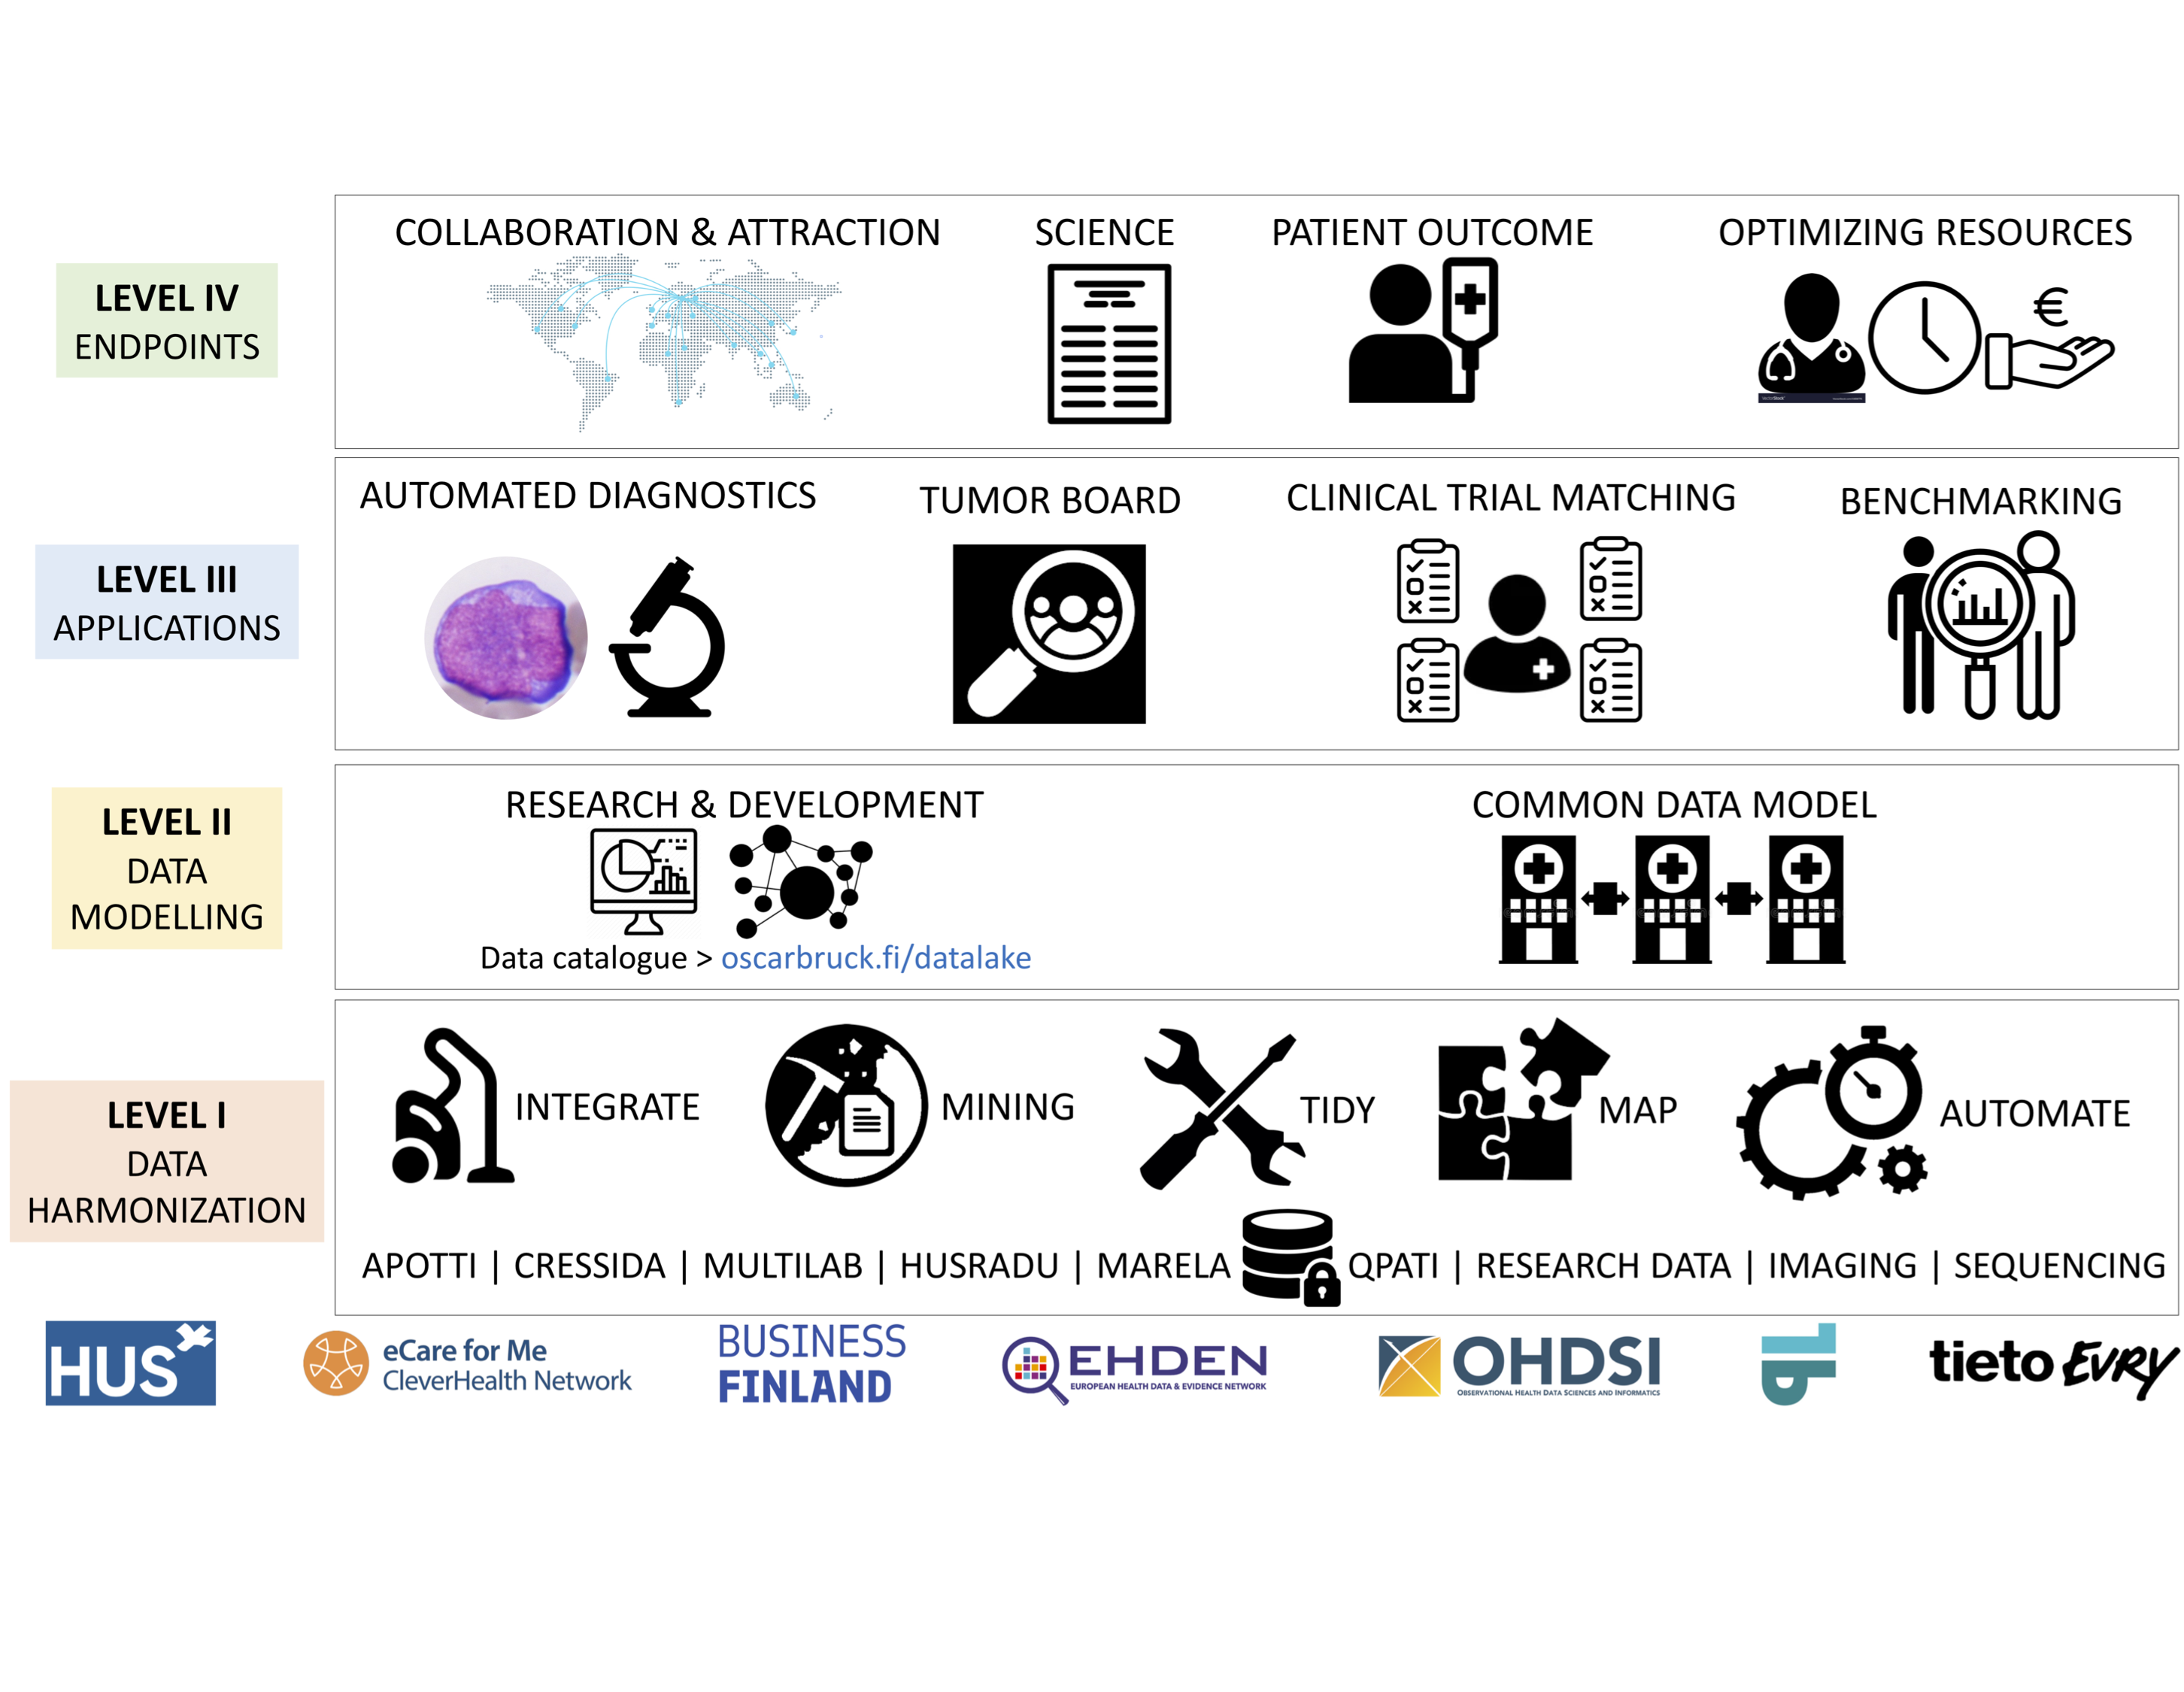 Hematology datalake catalogue
Dashboard of the HUS hematology datalake
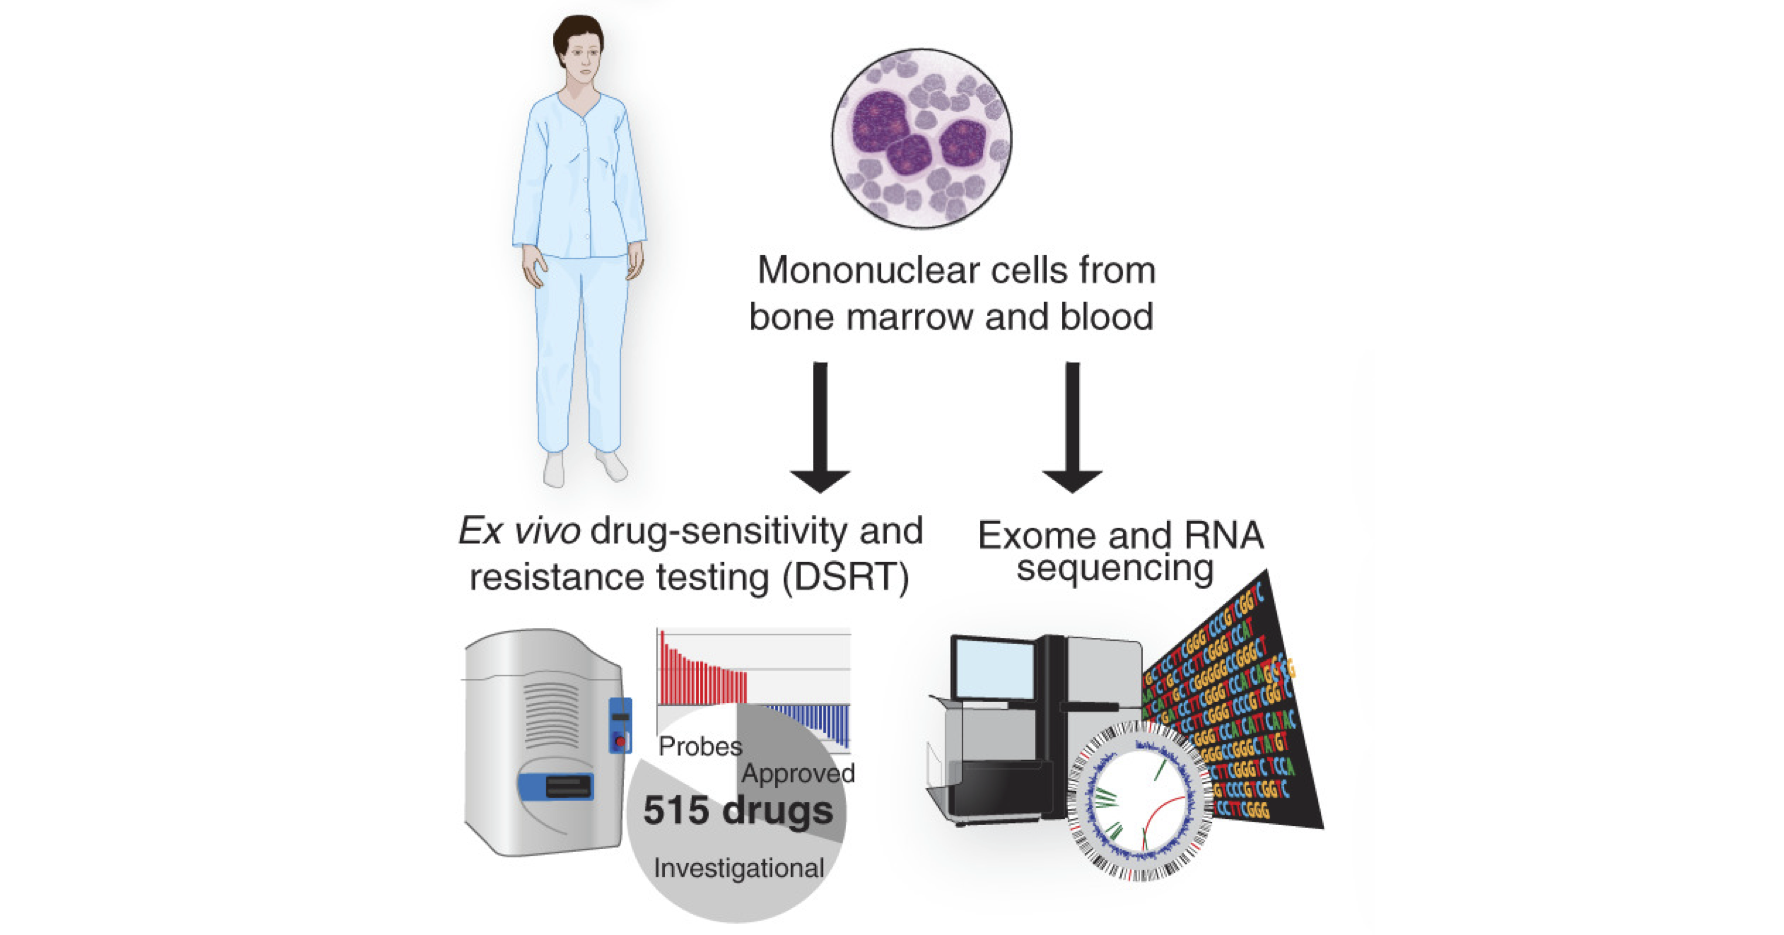 Implementing a Functional Precision Medicine Tumor Board for Acute Myeloid Leukemia
Clinical, drug sensitivity, RNA sequencing and mutation call data
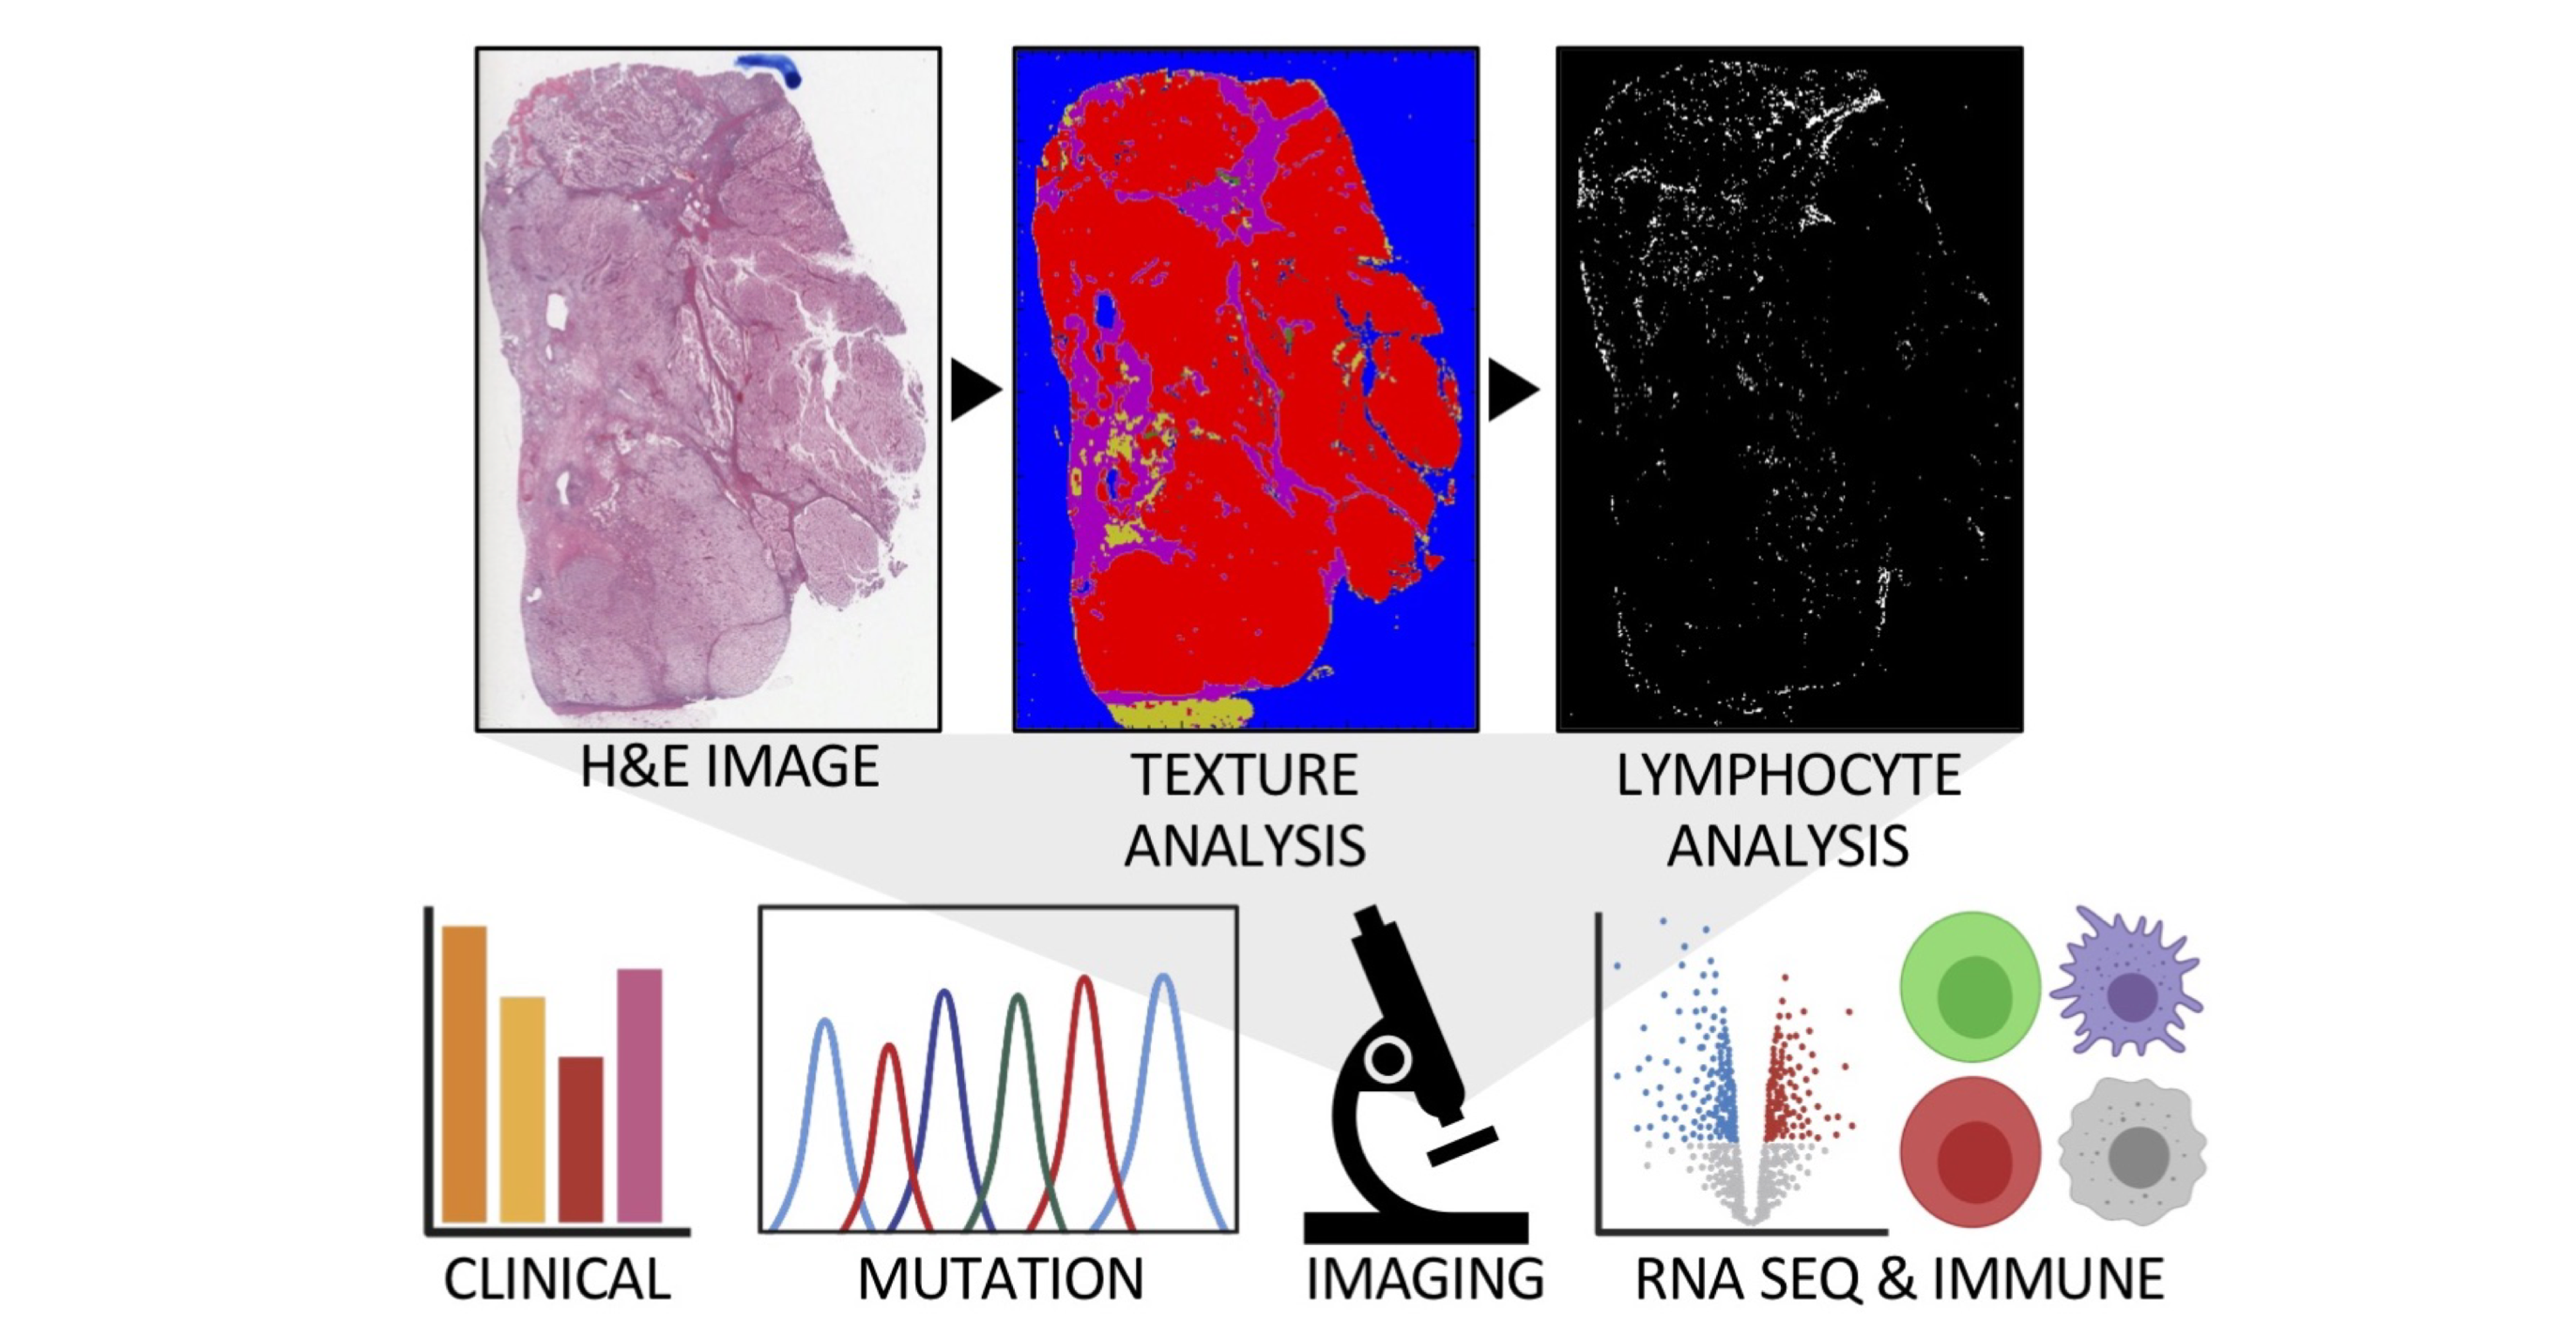
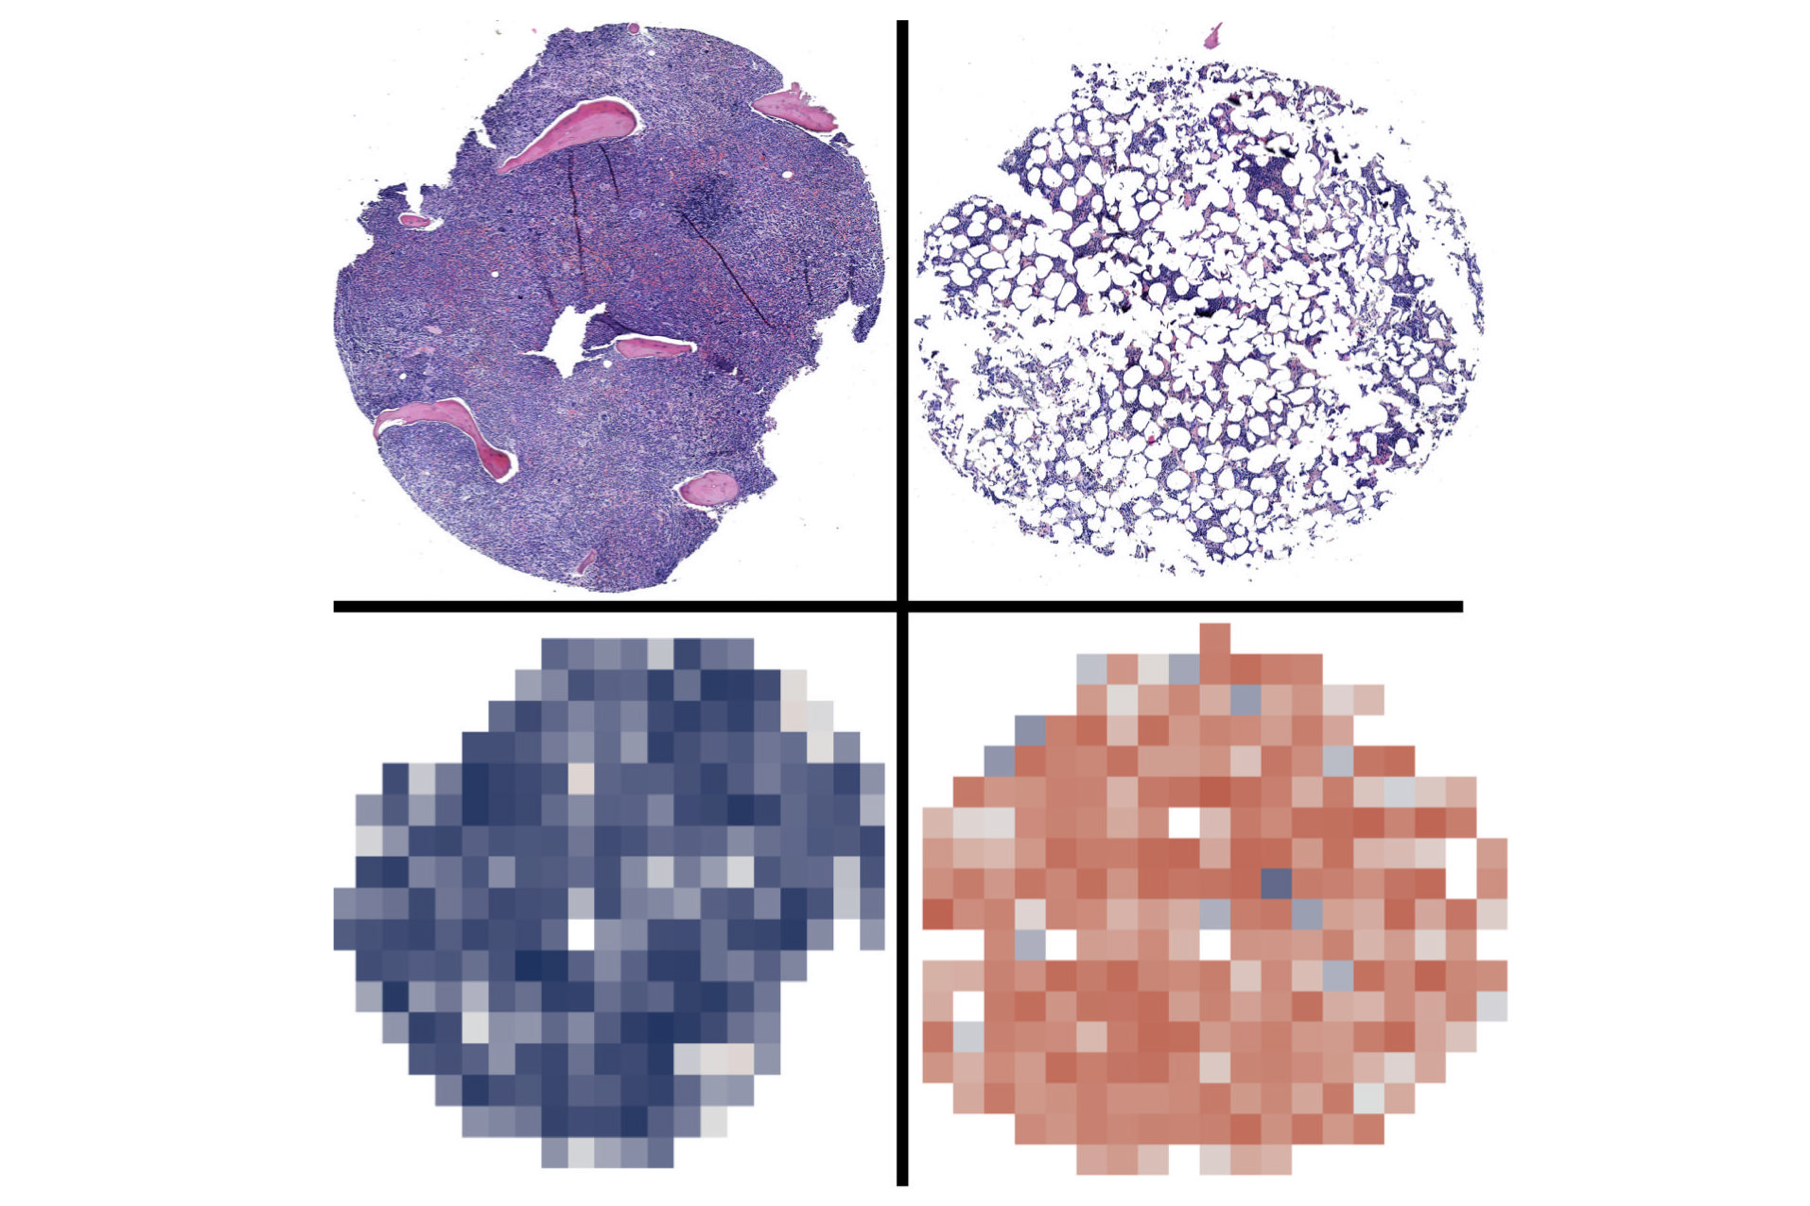
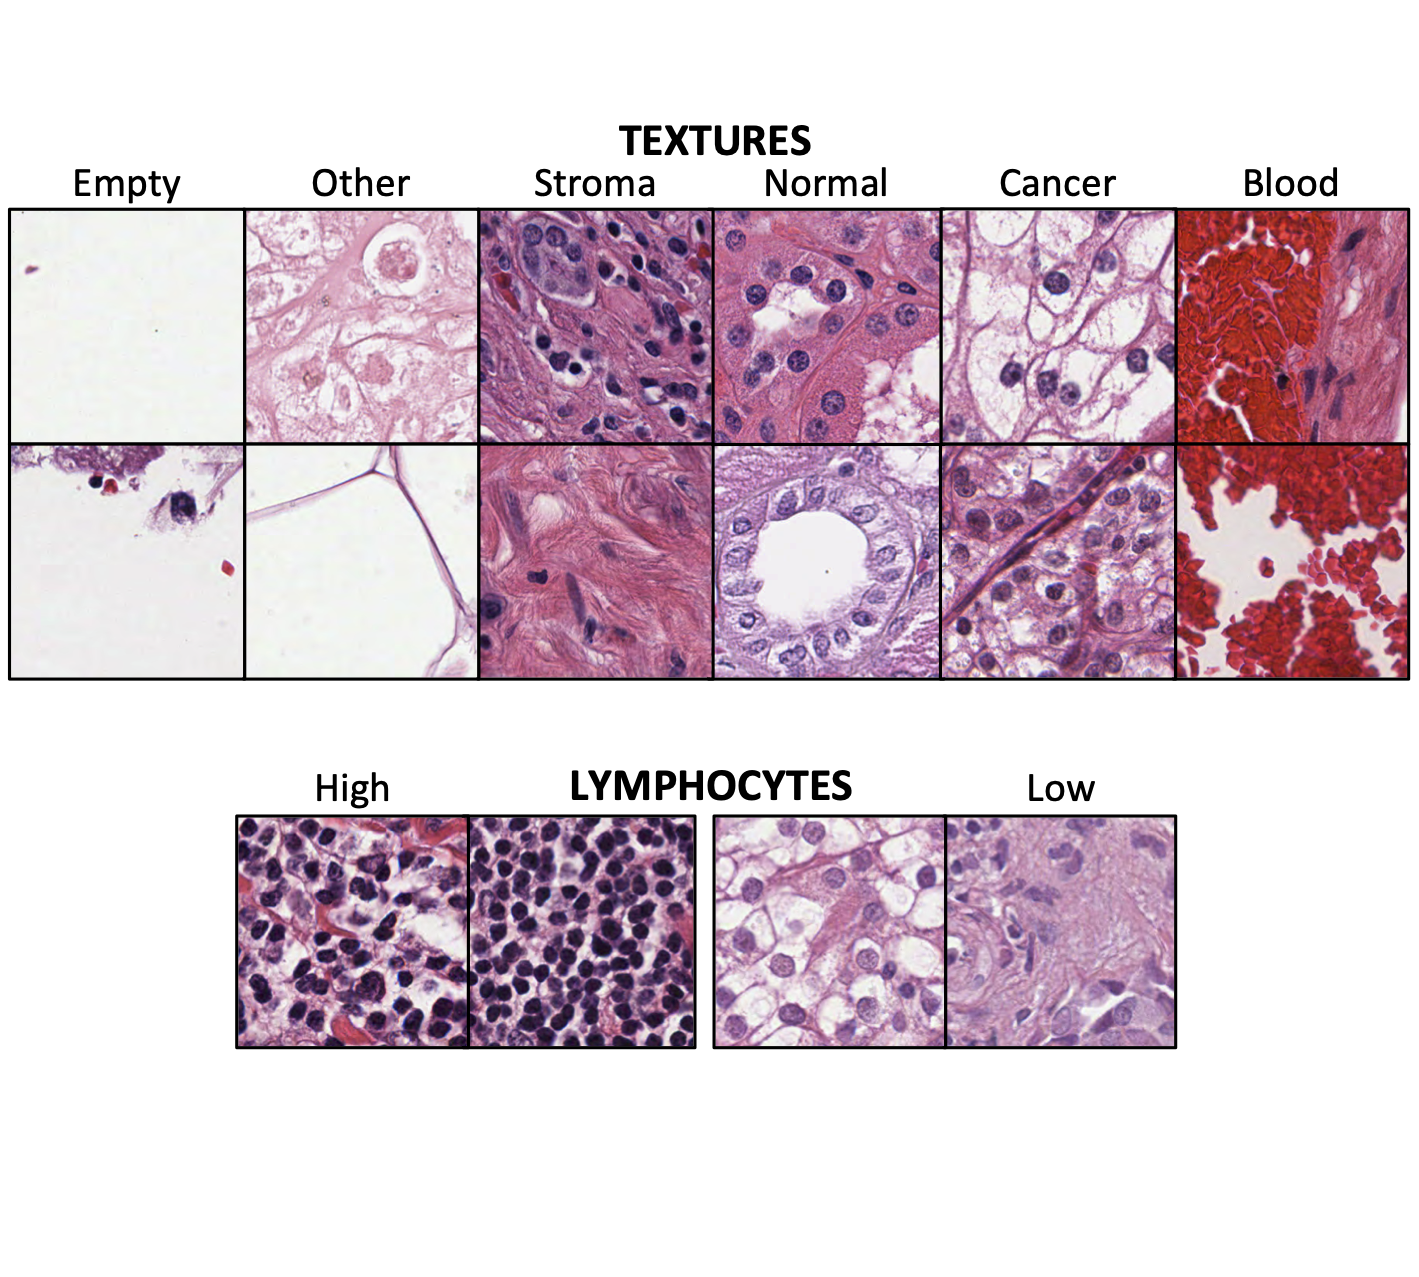 Computational analysis of RCC tissues and multiomics data
Six texture subtypes and lymphocytes were detected from H&E-stained nephrectomy sections with convolutional neural networks
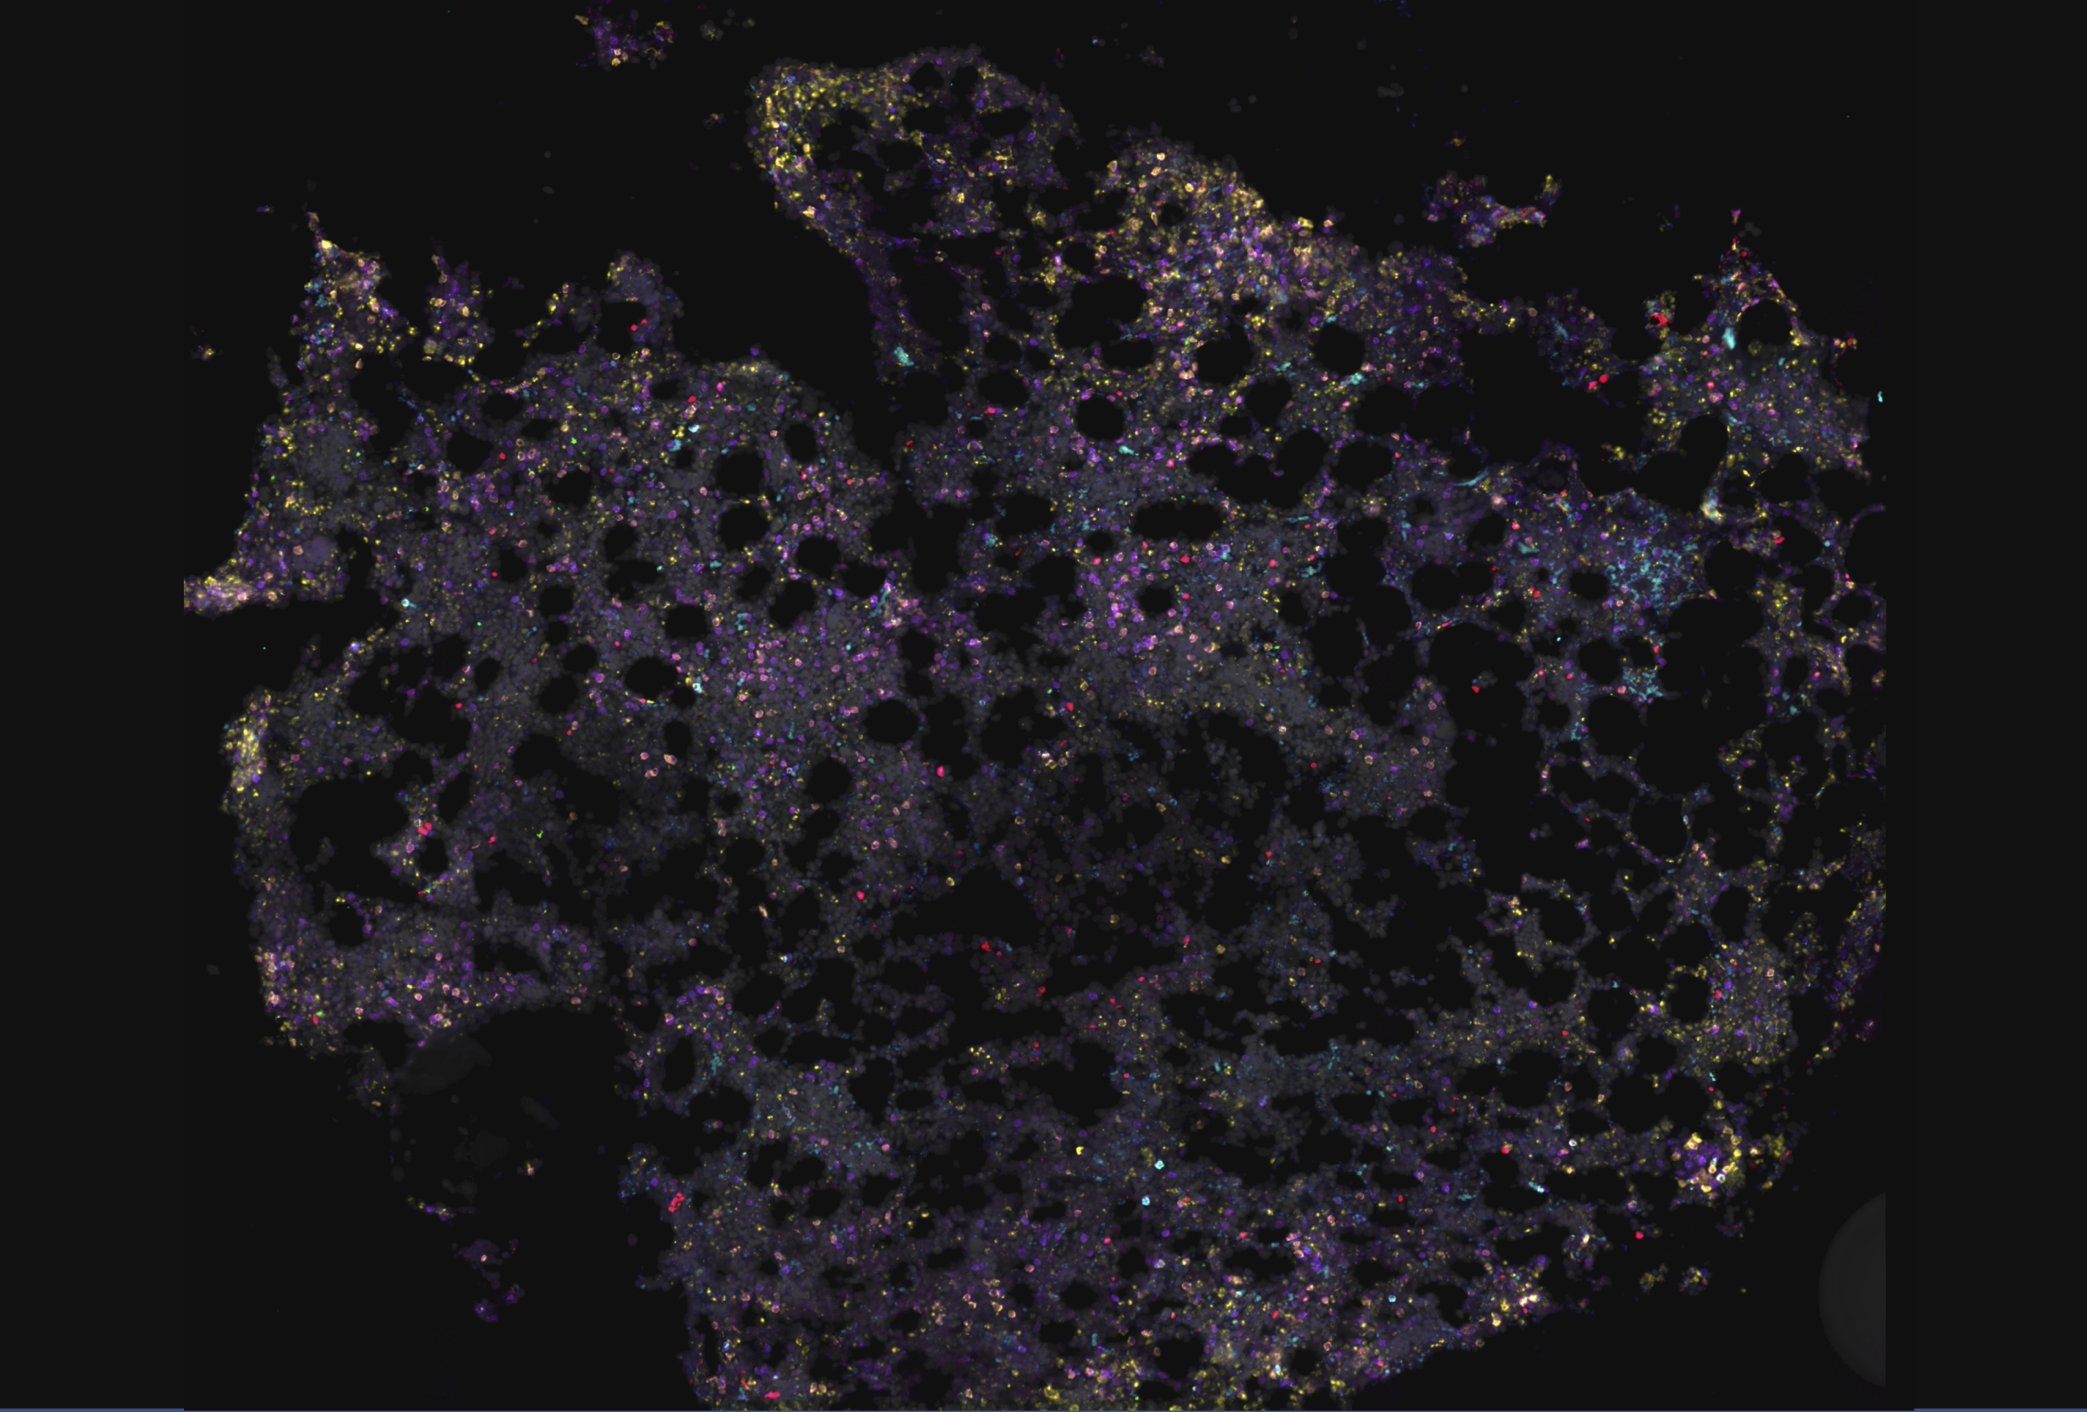 Immune Cell Contexture in the Leukemia Bone Marrow
Multiplex immunohistochemistry stainings on AML, ALL, CML and control human bone marrow samples
Applications
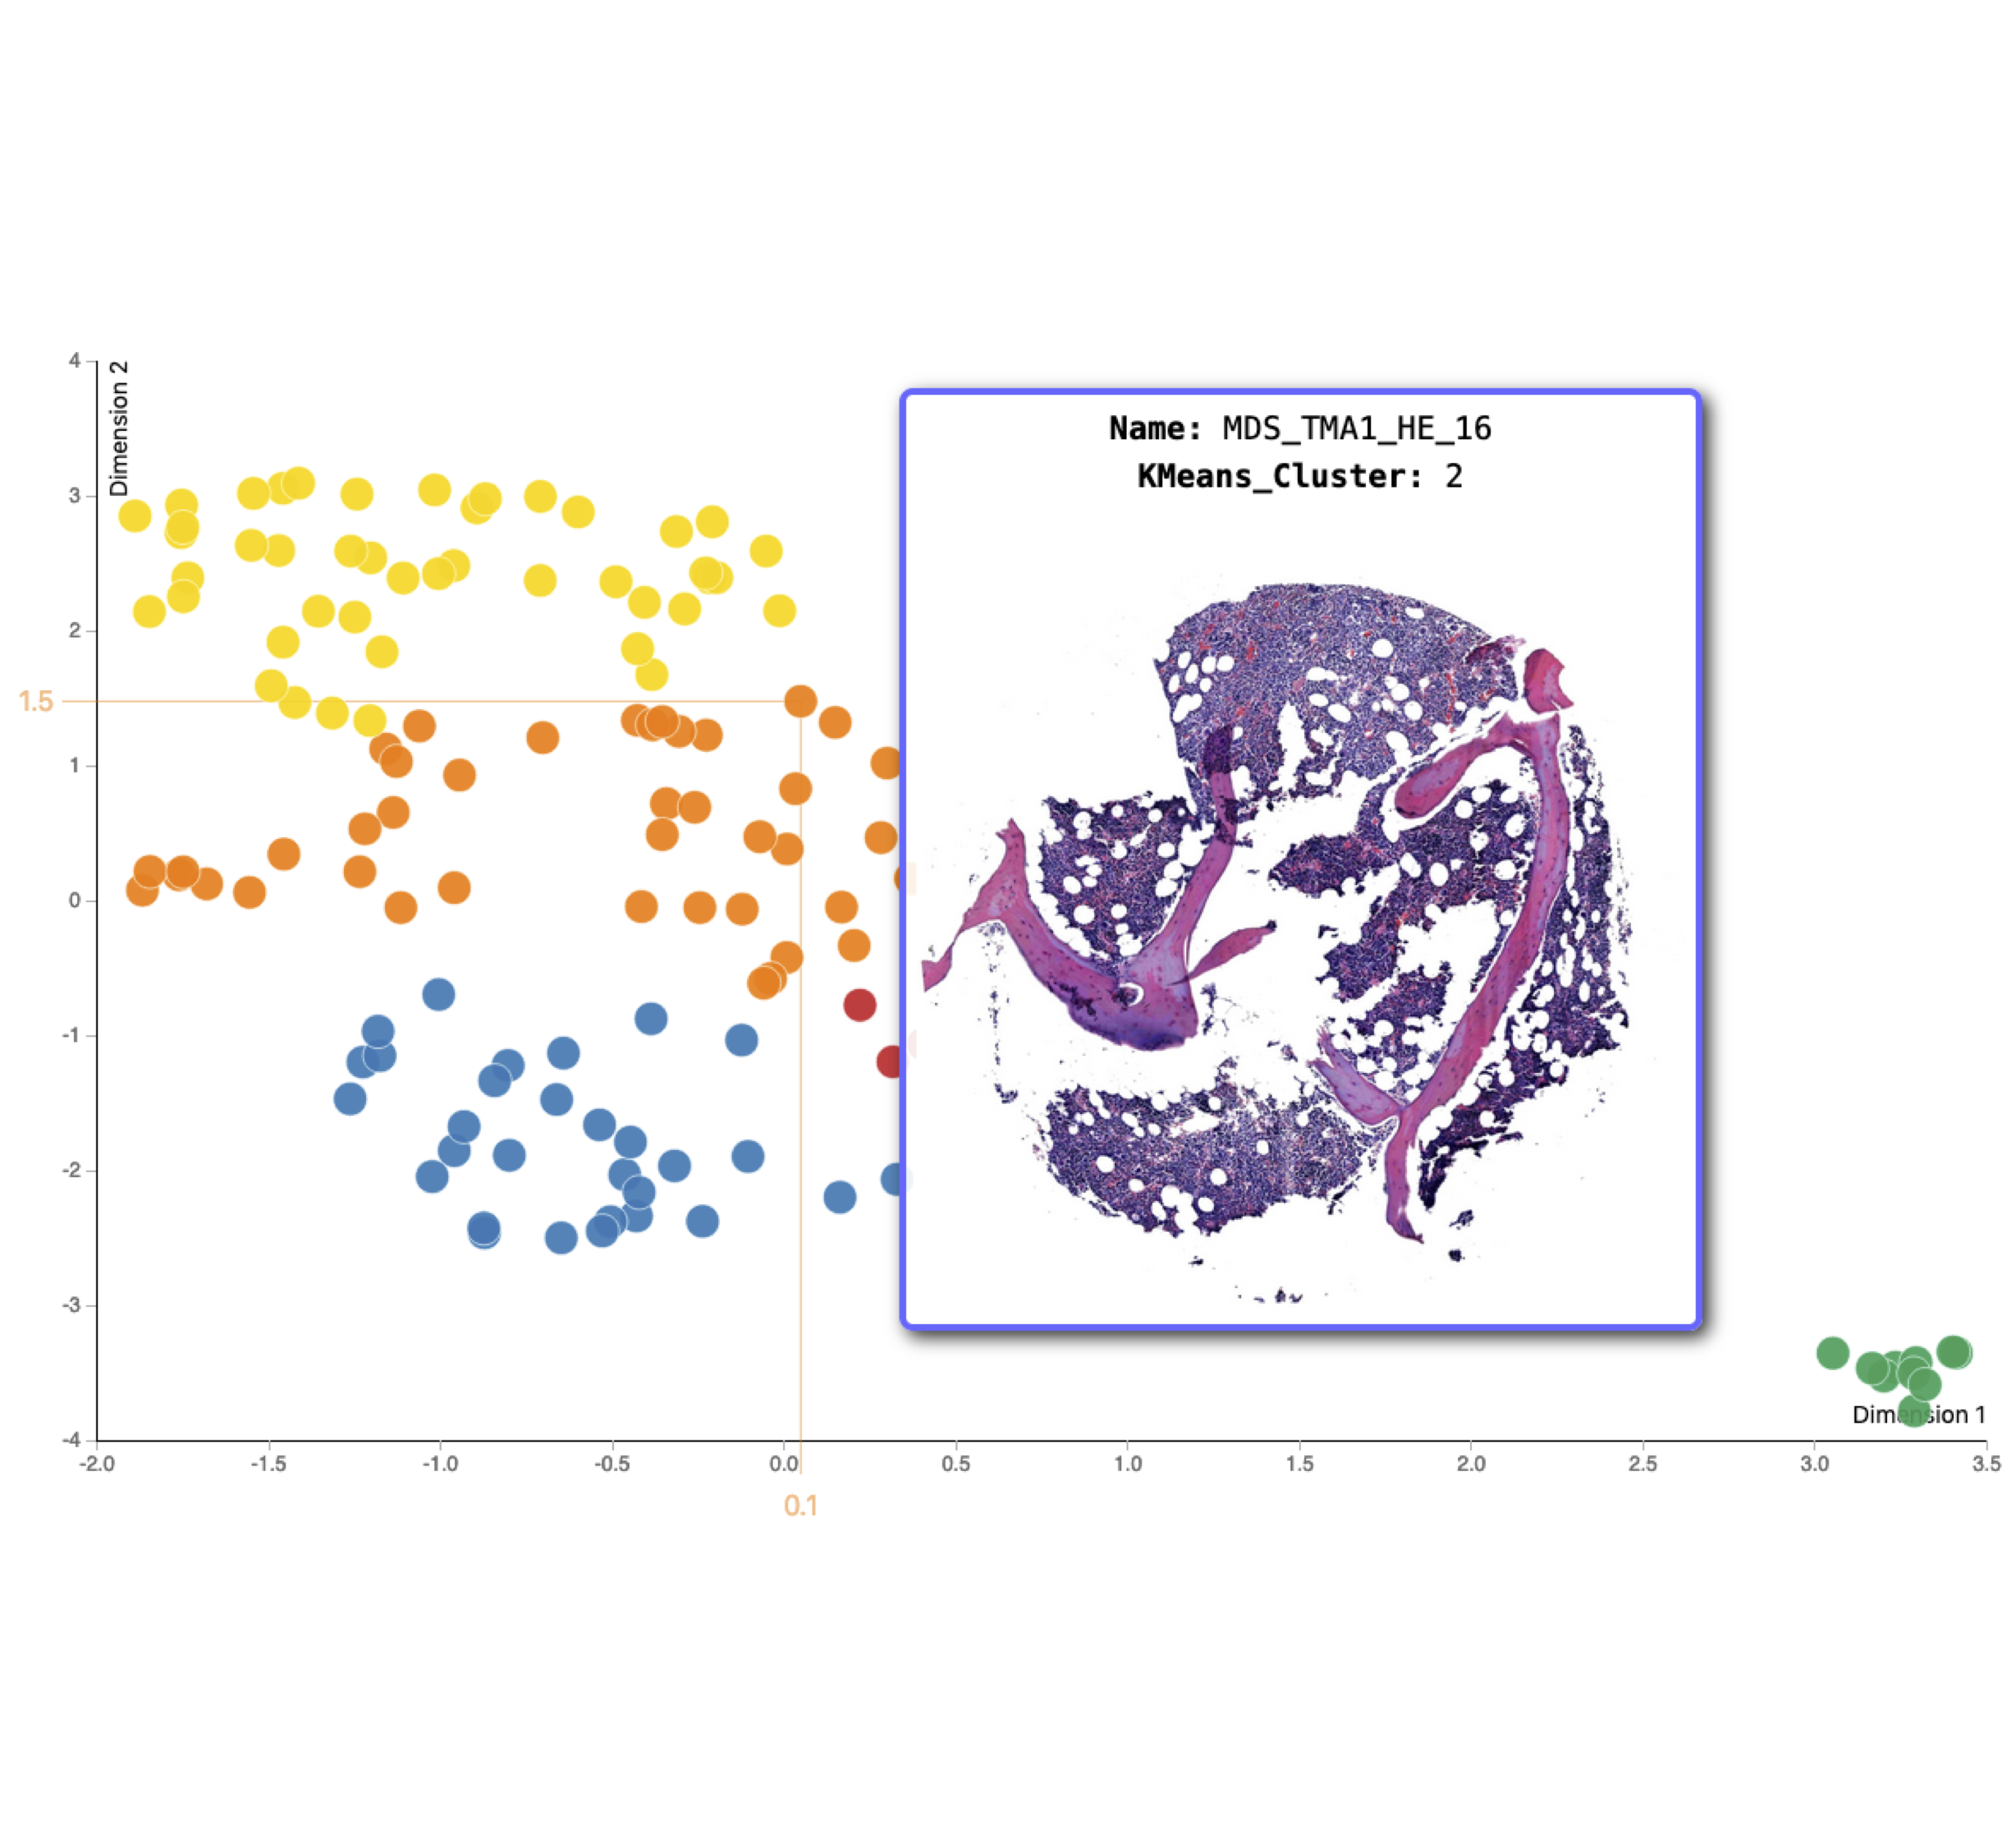 Deep MDS bone marrow tissue analysis
UMAP visualization of morphologic features of the bone marrow of patients with diagnosed myelodysplastic syndromes extracted with a convolutional neural network
 Computational analysis of RCC tissues and multiomics data
Six texture subtypes and lymphocytes were detected from H&E-stained nephrectomy sections with convolutional neural networks
Code
 Deep MDS bone marrow tissue analysis
Image and statistical analyses to link images of bone marrow biopsies to understandable information
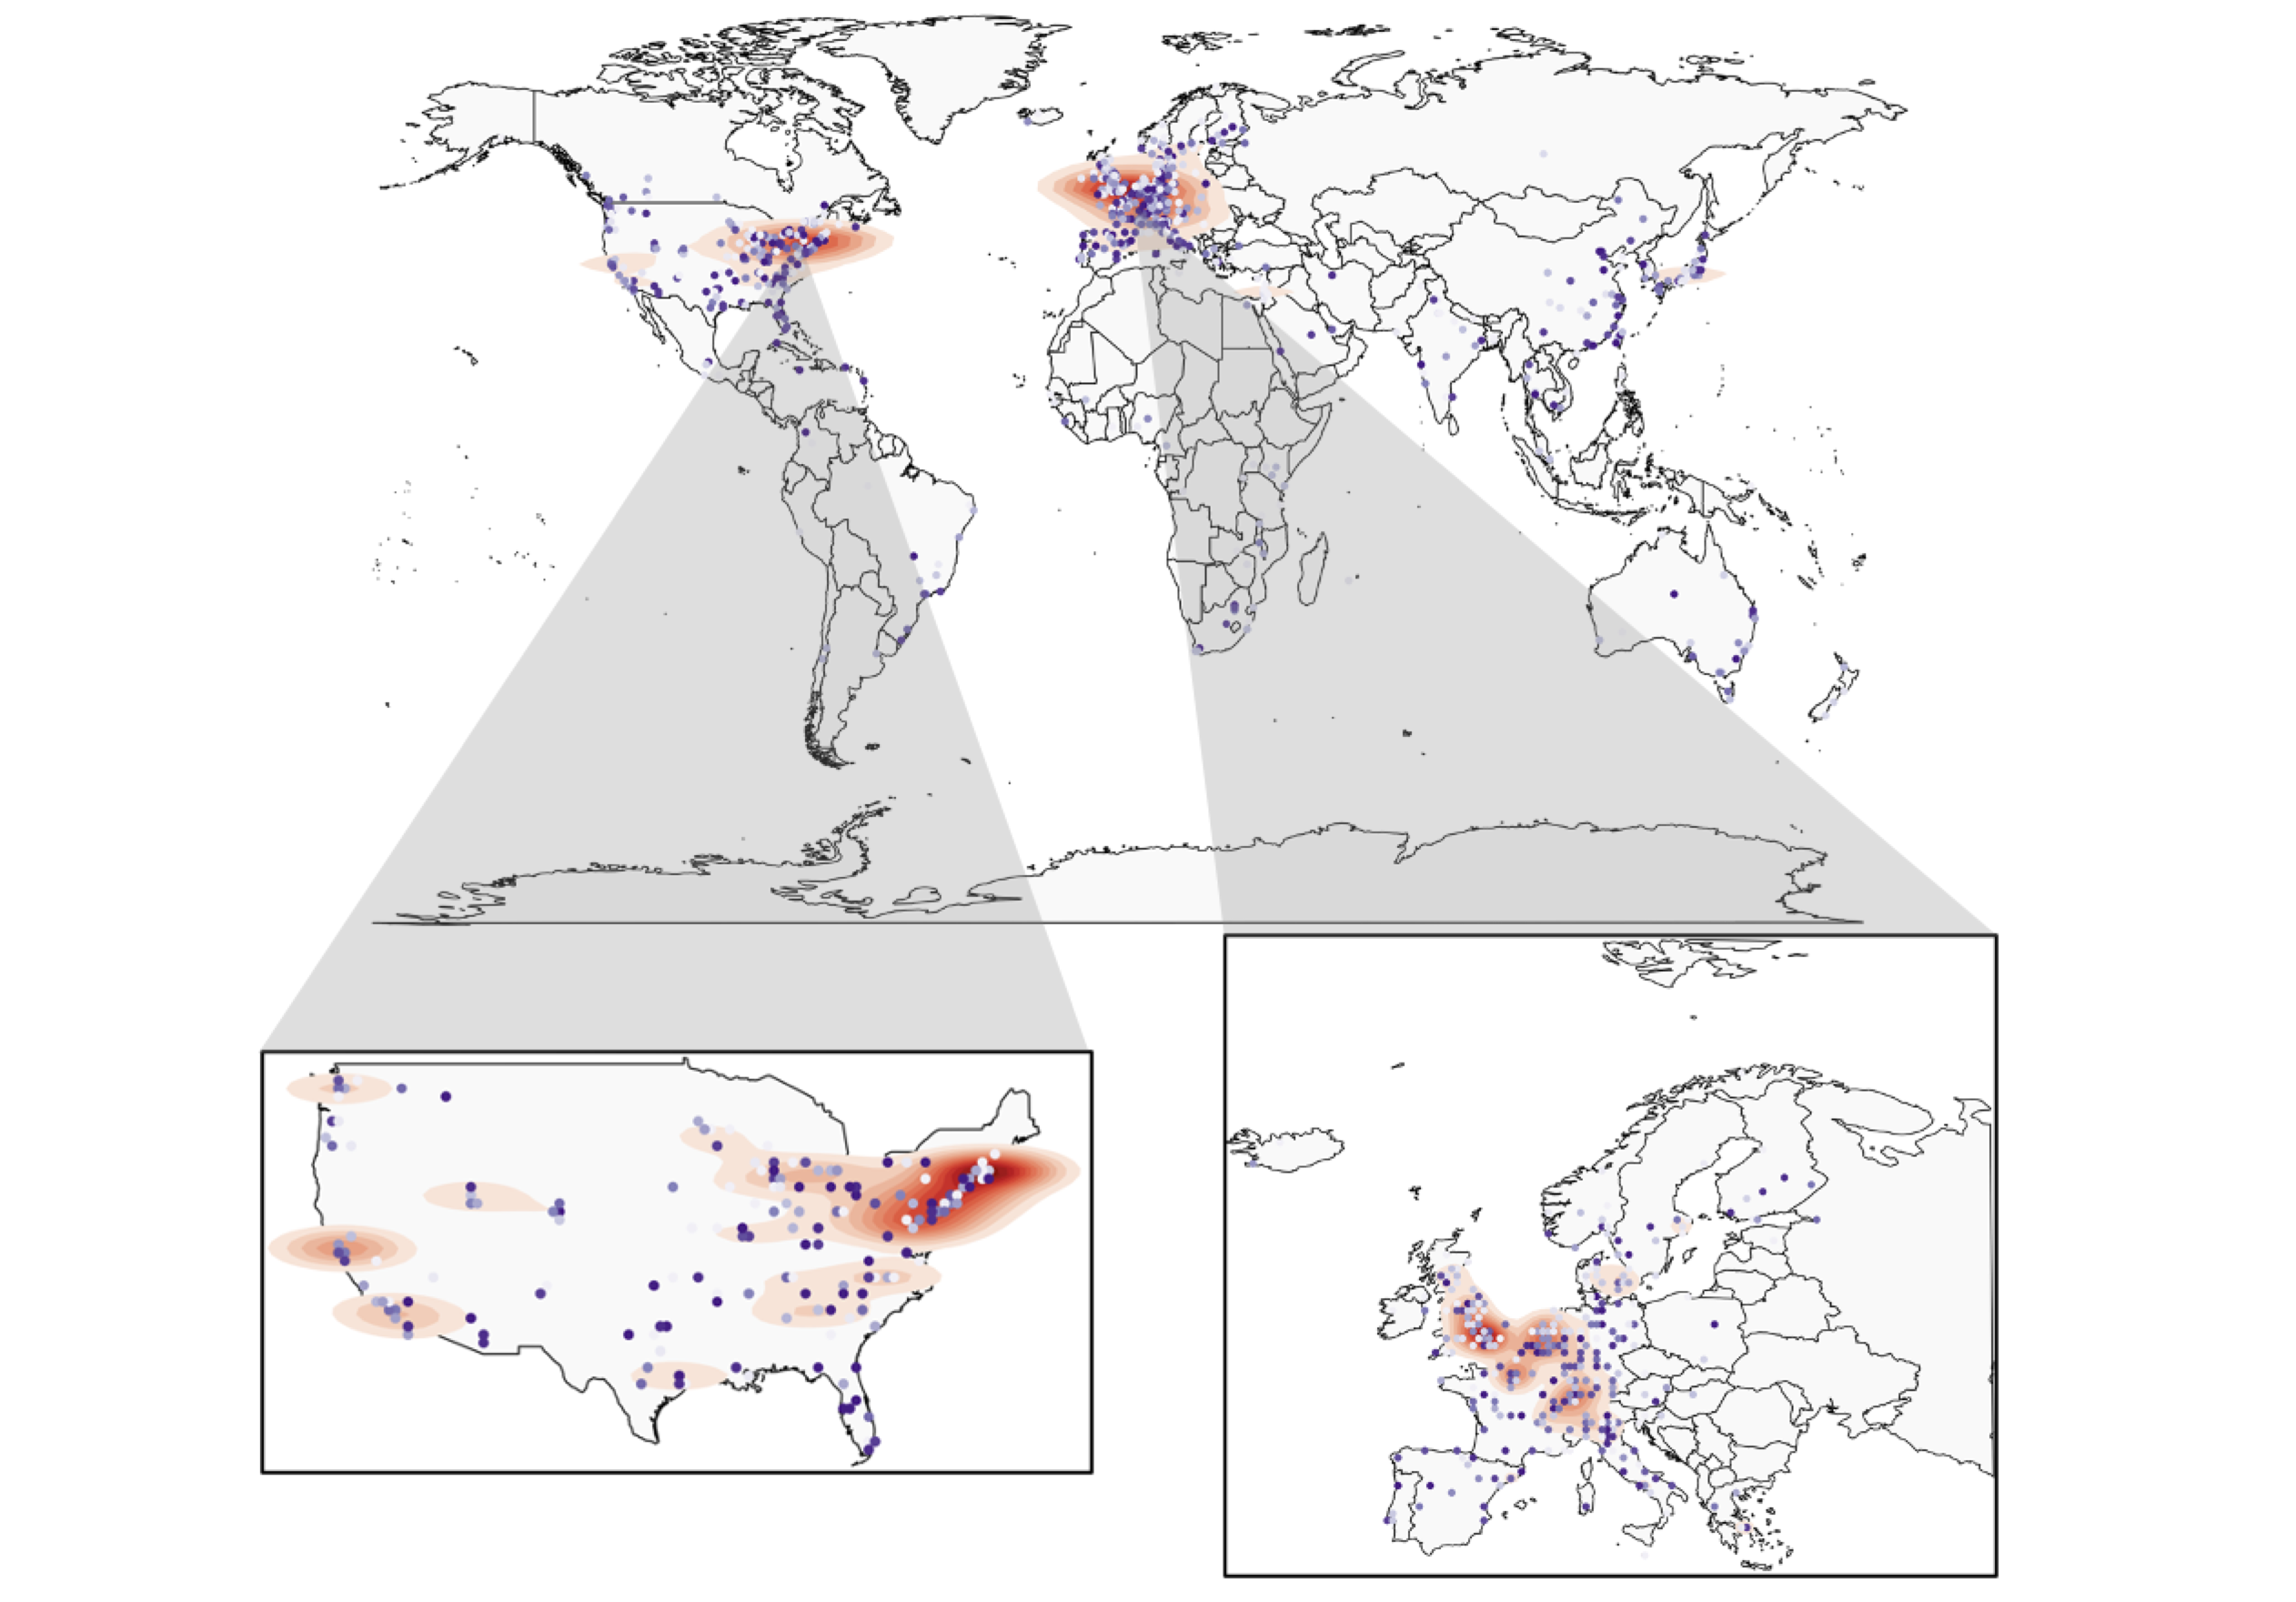 Bibliometric analysis of geographical and gender representation in high-impact journals
Reproduction of plots and statistical analyses of two publications on bibliometric analyses
Computational analysis of RCC tissues and multiomics dataStatistical analyses and visualizations to combine image features with multi-omics data
Computational analysis of RCC tissues and multiomics dataImage analysis to detect texture subtypes and lymphocytes